

Reason to trust
Strict editorial policy that focuses on accuracy, relevance, and impartiality
Created by industry experts and meticulously reviewed
The highest standards in reporting and publishing
Strict editorial policy that focuses on accuracy, relevance, and impartiality
Morbi pretium leo et nisl aliquam mollis. Quisque arcu lorem, ultricies quis pellentesque nec, ullamcorper eu odio.
Este artículo también está disponible en español.
XRP is turning heads again following an impressive show of resilience in recent days, bouncing from lows of $2.08 earlier this week to reclaim $2.4 at the time of writing. This upward momentum, now clocking over 15% gains from its test of the $2 support, has brought with it an interesting historical pattern on XRP’s daily chart.
A comparison of XRP’s current price structure with its 2017 trajectory shows that a rare setup may be indicating a massive breakout is on the horizon, with a price target as high as $9.
Related Reading: 3.5 Million TRUMP Tokens On The Move—Trump Team Makes A Big Play
XRP Price Flashes 1D Death Cross Signal, But Price History Suggests A Twist
On the surface, a death cross has appeared on the XRP daily candlestick timeframe chart. This sort of cross occurs when the 50-day moving average crosses below the 200-day moving average, and would typically be interpreted as a bearish sign. However, according to a crypto analyst on the TradingView platform, this might not be the case for XRP.
A closer look at historical precedent from 2017 suggests that this technical signal may not be as bad for XRP as it sounds. Back then, XRP exhibited nearly identical behavior of trading within a descending triangle just before the death cross occurred. That moment marked a deceptive shift, as XRP’s price action quickly flipped direction and exploded to the upside. Within weeks of the 2017 death cross, XRP went on to hit the 1.5 Fibonacci extension zone, delivering returns in excess of 1,350% from its pre-breakout level of $0.23 up until its current all-time high of $3.4.
XRP has again spent months consolidating within a tight descending triangle in the 2025 setup leading up to the current death cross which is the first in over a year. Despite the bearish implications of the death cross, the parallels in chart structure with the 2017 pattern and timing have made this formation a bullish wildcard.
A similar playout of the 2017 death cross rally would send the XRP price to new all-time highs at the 1.5 Fibonacci extension. In terms of a price target, the analyst noted that the 1.5 Fibonacci extension for this year aligns near the $9.00 price level, which would represent a 325% rally from XRP’s current price.
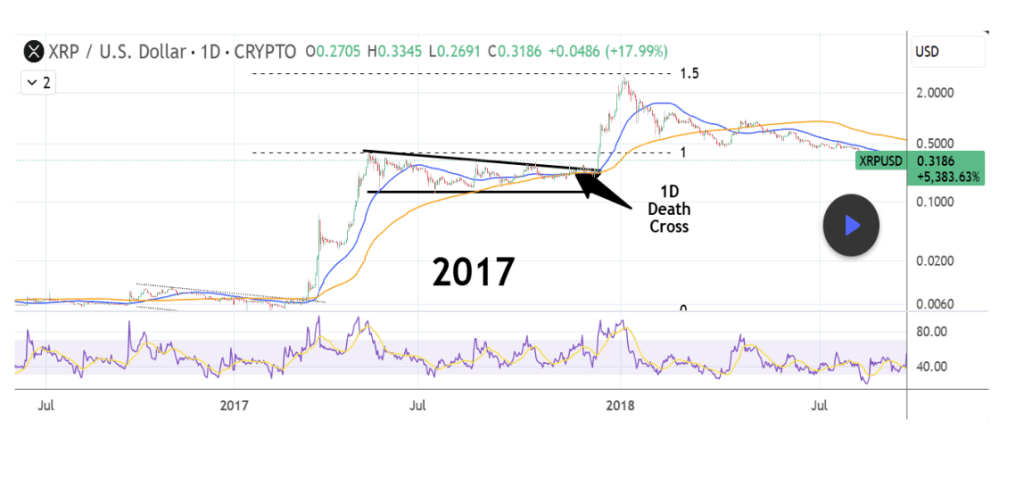 XRP 2017 Price Chart: Image From TradingView
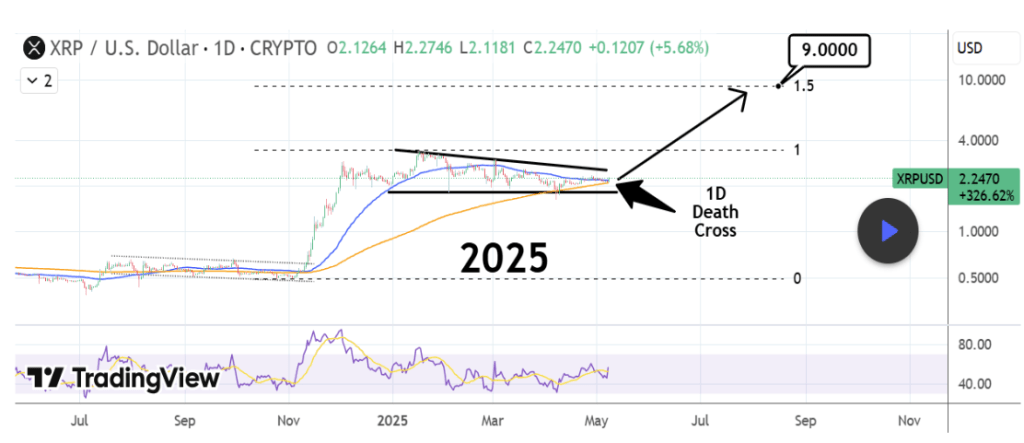 XRP 2025 Price Chart: Image From TradingView
Indicators Stay Neutral But Optimistic
Notably, the XRP price has a neutral but promising technical outlook across higher timeframes. XRP holds a Relative Strength Index (RSI) of 54.799 on the weekly timeframe. This is mid-range and shows there’s still plenty of room to climb before XRP becomes overbought. The MACD reading at 0.197 indicates mild upward pressure, while the ADX is at 30.423.
Related Reading
At the time of writing, XRP is trading at $2.38. The analyst’s bullish scenario depends significantly on whether institutional interest aligns with the technical breakout.
Featured image from Unsplash, chart from TradingView

 Poised for Takeoff — Bulls Prepare for Rally Reboot")


